Tables in a PowerPoint presentation help to show the data in a structured format while you present. The numbers presented have a better effect on the viewer when shown in the table. Microsoft Powerpoint has numerous ways to add a table to your presentation. You can choose to add a fresh table or copy from an existing table in another application like Excel or Word.
Method 1: Insert Table by selecting the rows and columns on the grid
Step 1: On the PowerPoint thumbnail, right-click on the main slide and select New slide.

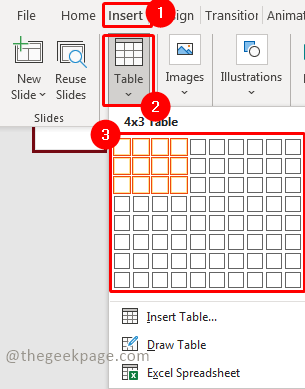
Step 2: Go to Insert and click on Table.
Step 3: From the dropdown menu, select the total rows and columns needed for the table.
Note: As you scroll the mouse over the boxes, the rows and columns will get selected. Scroll to the right to select the number of columns and scroll down to select the number of rows.
Step 4: Click on the final selection of rows and columns to have the table on the slide.

Step 5: Adjust the table to fit your slide.

Method 2: Insert Table by entering rows and columns manually
Step 1: On the PowerPoint thumbnail, right-click on the main slide and select New slide.

Step 2: Go to Insert and click on Table.
Step 3: From the dropdown menu, select Insert Table.

Step 4: In the dialogue box, select the number of rows and columns that you want to have in your table and click on OK.

Note: Please keep in mind that the top heading row will also be counted.
Step 5: Adjust the table to fit your slide.

Method 3: Insert Table through the table icon
Step 1: On the PowerPoint thumbnail, right-click on the main slide and select New slide.

Step 2: In the new slide, move the mouse over and click on the table icon in the center of the slide.

Step 3: In the dialogue box, select the number of rows and columns that you want to have in your table and click on OK.

Method 4: Draw your own table on a slide
Step 1: On the PowerPoint thumbnail, right-click on the main slide and select New slide.

Step 2: Go to Insert and click on Table.
Step 3: From the dropdown menu, select Draw table.

Note: This feature allows you to draw the table as you like with the help of your mouse.
Step 4: Left-click the mouse button and drag the mouse as you continue holding the click.
Step 5: Adjust the table as per size.
Step 6: Left click and draw the line across the table.
Note: You are free to draw a table as you like with this feature

Method 5: Insert a ready table from Excel
Step 1: On the PowerPoint thumbnail, right-click on the main slide and select New slide.

Step 2: Now go to the excel file where the table is ready. Copy the table data.

Note: Keep the number of rows and columns handy. Like in this example it is 10 rows and 9 columns.
Step 3: Now back to your PowerPoint, click on Insert, and select Table. In the dropdown select Insert Table.

Step 4: In the dialogue box, select the number of rows and columns that are present in the excel file table and click on OK.

Step 5: Click on the first cell of the table and press Ctrl+V to paste the data.

Note: This will import the complete table here.

Method 6: Excel Spreadsheet as Table
Step 1: Right-click on the PowerPoint thumbnail and click the New Slide option in the context menu.

Step 2: Go to Insert and select Table, in the dropdown select Excel Spreadsheet.

Step 3: Adjust the size as per your need by dragging it. Fille the content for the table in Excel spreadsheet added to the slide.

Step 4: Once the content is filled, click outside. You can see the excel spreadsheet in table format.

That’s All!! Which method do you prefer to add the table to a PowerPoint presentation? Do comment and let us know. Hope the article is informative and useful. Thank you for reading!!.