Every time a Windows 10 or windows 11 system crashes, it collects and stores some crucial information about the crash (like when and what caused the fatality) and stores it in the files as minidump files in Minidump. Analyzing the minidump file, you can easily understand the reason behind this error. In case, your computer recently crashed and you want to know how and where to find the minidump files, follow the methods of these article and you will be easily able to analyze the reason behind the problem.
But before going on ahead to open and analyze the minidump files on your computer, create a system restore point on your computer. In case, if anything goes wrong, you can simply restore the files and settings of your computer.
Method-1 Install Windbg from Microsoft Store
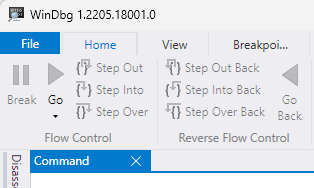
1 – Install Windbg the Microsoft store app for reading Memory dump files.
2 – Click on get in store app and then install it on your system
3 – Open Windbg app once it hets installed
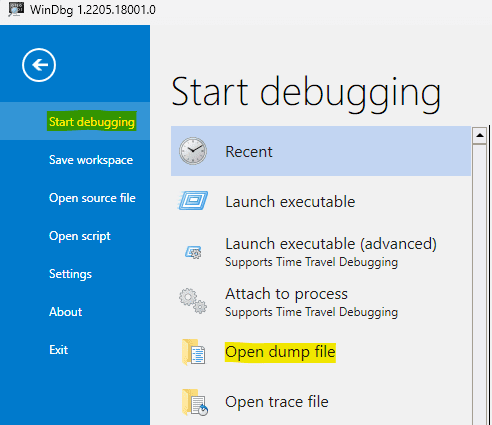
4 – Click on File Tab

5 – Now, click on start debugging in left menu.
6 -After this, click on Open Dump file

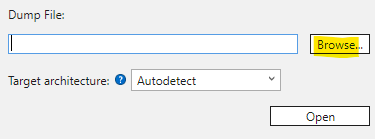
7 – Now, click on browse and browse the dump file.
Click Open.

8 – Now, type !analyse -v command in the command box and hit enter key

9 – Wait for some time for analysis to get complete. Windbg will show result of analysis on screen.
Method-2 Use BlueScreenView to analyze the minidump file-
BlueScreenView is a very good tool to analyze the minidump files on your computer. Follow these steps minutely to do so-
1. Download BlueScreenView on your computer. (Visit the website and scroll down through the page, click on the particular file matching with the CPU-architecture (32-bit or 64-bit) to download it).

2. After downloading the file on your computer, extract the “bluescreenview-x64.zip” file in a location of your choice.

3. After extracting the zip file, go to the extraction site on your computer. Double click on “BlueScreenView” to run it on your computer.

4. In the BlueScreenView window, you will be able to see the description of the “Dump File“, “Crash Time“, “Caused By Driver” of the minidump files on your computer.

5. If you want to jump in for more deep understanding of the dump file, simply double click on it to check the properties of the particular file on your computer.

6. If you want to analyze the reason and want to find the remedy for the cause of the problem, simply right click on the dump file and then click on “Google Search-Bug Check+Driver“.

This way with BlueScreenView, you can easily check what caused BSOD on your computer and follow up to find the process to delete the root cause of the problem.
Method-3 Use Windows Debugger to analyze the minidump files-
Windows Debugger is a complete analyzer of minidump files on your computer.
1. Download Windows 10 SDK on your computer. Click on “DOWNLOAD THE.ISO” The latest version of Windows 10 SDK will be downloaded on your computer.

2. Mount “KSDKWIN10_MULFRE_EN-US_DV9” .iso file on your computer to visualize the files.
3. Double click on “WinSDKSetup” to run the setup on your computer.

4. In Specify Location window, choose “Install the Windows Software Development Kit-Windows 10.0.18362.1 to this computer” and then click on “Next“.
5. You can choose a separate installation directory on your computer by clicking on “Browse“.

6. In the License Agreement window, click on “Accept” to accept the agreement to install the kit on your computer.

7. When you will be prompted for ‘Select the features you want to install‘, only check the option “Debugging Tools for Windows” and then, click on “Install“.

The installation process will consume some time.
8. When the installation process is complete, simply click on “Close” to close the setup window.

9. Press Windows key+R to launch Run window on your computer, type “cmd” and press Ctrl+Shift+Enter to open Command Prompt window with administrative rights.

10. In Command Prompt window, copy-paste these commands one by one and hit Enter after each of them to execute them sequentially on your computer.
cd\Program Files (x86)\Windows Kits\Debuggers\x64\
windbg.exe -IA

11. Click on the search box and type “windbg” and then right-click on “WinDbg(x64)*” and click on “Run as administrator” to open WinDbg on your computer. WinDbg window will be opened.

[*NOTE- Choose the particular “WinDbg” version to open it according to the CPU-architecture (x64-bit or x86-bit of your system. ]
12. In WinDbg window, simply click on “File” and then click on “Symbol File Path“.

13. In Symbol Search Path, copy this line and paste it in ‘Symbol path:‘. Finally, click on “OK” to save it.
SRV*C:\SymCache*http://msdl.microsoft.com/download/symbols

14. In the WinDbg window, click on “File” and then click on “Save Workspace” to save the changes.

15. Press Windows key+R to launch Run on your computer. Type or copy-paste this folder location and then hit Enter.
C:\Windows\Minidump

16. In the Minidump folder, double click on the minidump file you want to analyze on your computer.
The minidump file will be opened in WinDbg.

[ Important– As this is the first time WinDbg is analyzing a minidump file on your computer, it will take some time to load the Kernel symbols. This entire process runs in the background. So, if WinDbg appears to be stalled or unresponsive, don’t interrupt the process. ]
17. Once, the kernel symbols are downloaded on your computer, click on “!analyze -y” to get full analysis of the problem.

18. Now, wait for a while as the crash data will be analyzed. After the analyzation process is over, find ‘MODULE NAME:‘ and click on the respective module name to further know about the location of the file which has caused the failure. (Example– We have clicked on “nvlddmkm“).

19. Now, press Ctrl+F to open Find window, now type “probably caused by” then click on “Find Next“.

You will see the reason for which your system had crashed. You can also notice the “BugCheck” code just below the cause of the problem. Now, compare the BugCheck code with Microsoft BugCheck Code Reference list to have an insight on the root cause of the problem.