There are lots and lots of data churned every day across all industries. Data is a valuable resource for businesses that can get unmanageable. Moreover, raw data does not really make sense in its actual form. While some big firms have specialized teams to perform big data analysis, not every company has that kind of resources to carry it out.
Fortunately, technology has gifted us with data visualization tools that help streamline business functions, improve efficiencies internally, and even help understand your customers better. From charts, videos, or infographics to modern solutions like AR and VR (augmented reality and virtual reality) we have endless options that make your presentations engaging and a spontaneous way to communicate.
We have shortlisted 20 best data visualization tools in the business and divided them into two categories – for presentations (no coding) and for developers (coding).
Presentations/Non-Developers (No Coding Required)
Tableau

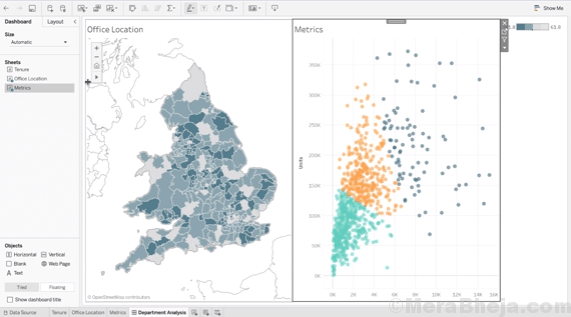
Thanks to its ease of use and the power to generate interactive visualizations of much higher quality than those by the usual BI tools, Tableau is often viewed as the champion of the data visualization software. It boasts a huge customer base of over 57, 000 accounts throughout many industries. It’s adept in handling the fast changing and larger datasets used in Big Data operations that’s perfect for corporates.
You can download the desktop app for visual analytics and can create graphs, charts, maps, etc. But, if you are unable to install the software, you can visualize the reports online or on your smartphone using a server solution.
Free Trial – 14 Days
Cons -Pretty expensive comparatively and inflexible pricing.
Register here: https://www.tableau.com/
Infogram

With Infogram, you can create visualizations based on both charts and infographics online. It comes with a free and two upgraded options (paid) that feature more than 200 maps, icons collection, private sharing options, and more.
Overall, you are allowed to link your visualizations and infographics to big data in real time which in itself is a big bonus. It just takes 3 easy steps and you can choose from the wide range of featured templates, personalize them with charts, images, videos and maps and there you have your visualization ready to be presented.
Free Trial – 30 Days
Cons – random limitations on the number of pictorial graphics that you can add with the free version.
Register here: https://infogram.com/
Sisense

Looking for data sources and assimilate them into all your business functions? Then, Sisense is a great option for you. This highly customizable data analysis tool allows you to create, assess, and visualize all of the data generated by your company. This is a complete solution that can support thriving datasets generated from several different areas of your business. Best of all, this tool is extremely flexible supporting third-party plugins and even add customizations using JavaScript APIs.
Free Trial – 14 Days
Cons – Needs a level of knowledge
Register here: https://www.sisense.com
Adaptive Discovery

You can keep a close check on all your data generated by your company with the good number of dashboards just as in Sisense. You get a diverse range of data visualization methods that includes charts, funnels, histogram, radar, dial and waterfall.
With an in-built advanced intelligence the system effectively delivers its study based on your company’s budget and prognosis. This makes it convenient if you want to avoid working out complicated equations and formulas on your own. Leave it on the software and it will handle everything automatically.
Free Trial – 30 Day
Cons – Offers no integration or customization features.
Register here: https://www.adaptiveinsights.com/products/analytics-and-dashboards
Plotly

Those looking to create some sharp and sleek charts within minutes, Plotly is just what they need. It’s a web-based data analysis and graphic software that’s popular with names like Google, Gooji, The New York University, and The U.S. Air Force.
It offers a good collection of chart types equipped with in-built sharing features, while the look and feel of the charts and graphs are professional. All you need to do is to load your information and customize the design, axes, notes and legend, and all of this take just a matter of minutes.
Free Trial – Available
Cons – Comes only with Javascript and not jQuery. No Canvas.
Register here: https://plot.ly/
Datawrapper

Perfect for interactive charts, this online tool is especially designed for the publishers and journalists who add live charts into their articles. Upload or paste your data (from CSV file) into the field, Datawrapper will instantly create a visualization with lines, bars and more. It’s a simple to use tool that generates some really good graphics.
Free Trial – Available; For limited period
Cons – No advanced data clean up.
Register here: https://www.datawrapper.de/
Raw

The website reads “the missing link between the spreadsheets and the vector graphics”. It’s an easy to use software offering faster results. You Big Data can be taken from any source like MS Excel, Google docs, Apple Numbers or simply from a comma-separated list. You can choose from the 16 chart types in the library and the browser processes it.
The best part is, that the visualization can be exported conveniently and a designer can then make it sharper since the tool is compatible with Inscape, Adobe Illustrator and Sketch.
Free Trial – Available
Cons – No log scale; Limited selection of visualization.
Register here: https://rawgraphs.io/
ChartBlocks

ChartBlocks is a well-designed online chart building software that helps you create basic charts pretty fast. It comes with restricted variances of charts, but it still offers most common variances. Moreover, you can bring in more data from different external sources like databases and spreadsheets. Once the chart is complete, it can either be exported through SVG or PNG, add it to your website or share it on the social media platforms.
Free Trial – Available
Cons – free basic plan offer limited templates; sharing option requires embed code.
Register here: https://www.chartblocks.com/en/
Visme

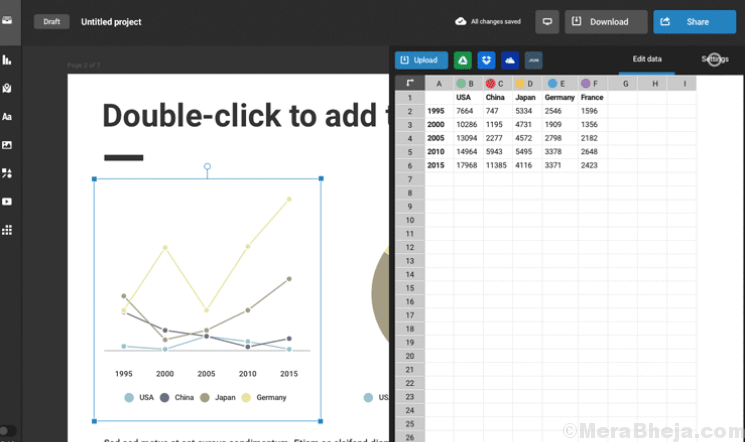
Visme is for the business owners and professionals who need to create presentations with different visual elements for personal use or meetings. Your business content and data are transformed into attractive presentation, charts, graphs, widgets, videos and infographics in matter of minutes. Bonus – you can even choose to edit according to your preferences.
Free Trial – Free option available
Cons – No analysis element
Register here: https://www.visme.co/
FusionCharts

It perhaps offers one of the most comprehensive libraries with a vast collection of charts and maps. It features more than 90 chart variances and around 965 maps that supported on all devices and platforms. The best part is, starting from IE 6 it’s compatible with all browsers that includes old and modern.
This software is compatible with both data formats that is, JSON and XML. Not just that, you can also export your completed charts in PDF, JPEG, PNG and SVG formats.
Free Trial – 30 days
Cons – On the expensive end
Register here: https://www.fusioncharts.com/
Ember Charts

It’s based on the Ember.js configuration and D3.js. It offers tools like bar, scatter charts, pie and time series for your use. It’s a sophisticated software that’s easy to spread. It’s the same team behind the Ember Charts (that created Ember.js.) that emphasizes on best practices and interactivity. The best part is, Ember Charts handles errors gracefully and prevents the app from crashing when loaded with unky data.
Free Trial – Free and open source
Cons – Steep learning curve
Register here: https://emberjs.com/
Qlikview

Qlikview stands to be the biggest competitor of Tableau in the current market and so, undoubtedly one of the biggest players. With over 40,000 customers across 100 countries and more, the site offers an extremely customizable setup with wide range of features. Moreover, it also offers reporting capabilities of strong business intelligence, analysis, and enterprise. What’s best about this tool is the clean and organized interface.
Free Trial – 14 days
Cons – Takes longer to get a grip on and use it to its max potential.
Register here: https://www.qlik.com/us/
Developers (Based on Coding)
Google Charts

Google Charts helps you create interactive charts and run on HTML5 and SVG. With its aim at Android and iOS, it is completely compatible with cross-browsers that includes the older version of IE supported through VML. You can even zoom the charts for convenience. It’s a user-friendly software with a pretty large gallery featuring a nice collection of visualization and interactions.
Free Trial – 15 Days
Cons – Not much customizability; requires network connection.
Register here: https://developers.google.com/chart/
D3Js
Better known as D3.Js, the “Data Driven Documents” uses HTML, CSS and SVG to deliver some stunning charts and diagrams. This beautiful feature packed tool, rich in interactivity offers one of the best visualization library and runs on JavaScript.. It comes with a nice gallery that showcases all that can be done with D3. D3.Js is IE9+ supported.
Free Trial – Free and open source
Cons – no pre-built charts; steep learning curve
Register here: https://d3js.org/
TapClicks

If you are marketer churning a lot of data for your business, then TapClicks is the software you need for identifying the customer trends. It’s a platform for digital marketing and analytics that’s targeted mainly at digital agencies, enterprises, and media companies. It comes with a central and consolidated dashboard that helps you stay updated with all your marketing data.
Moreover, you can also access the library that features visualization and widgets that help you to alter the system to make it suitable for you. You can even export the data to PDF, Word, Excel, and email. You can further share this with your team mates and analyse.
Free Trial – 14 Days
Cons – Mainly for marketers; no filtered viewing.
Register here: https://www.tapclicks.com
Grow

If you own a larger organization with several teams, then your search ends with Grow. It comes with a dashboard that’s designed to integrate data from several different sources that includes databases, SaaS applications and spreadsheets.
Grow makes it possible for you to implement dashboards for each department in your company and then use the extracted information to apply to new team goals and strategic targets.
Free Trial – 30 Days
Cons – long load times, filtering data is challenging in some cases.
Register here: https://www.grow.com/
Chartjs

If you are up for a small project, then Chart.js can be your best bet. It’s an open source and small software that works at just kb. It’s user-friendly, fast and supports six variants of charts such as, pie, line, radar, bar, doughnut, and polar. That’s not all, as you can also add and delete any of these 6 chart types to minimize your footprint.
It supports IE6/7 with HTML5 Canvas and moves with polyfills. The GitHub page of Char.js is increasingly getting popular and is sure worth your time to keep a watch if looking for easy and fast charts.
Free Trial – Free and opens source
Cons – Non-interactive and offers just basic graphs.
Register here: http://www.chartjs.org/
NVD3

For those who don’t know, NVD3 runs above D3 and looks to create charts and components that can be reused. This is to keep all your charts tidy and in customizable condition. it comes with a simple interface above D3.js and retains all it strong features. This tool is designed by the leading engineers at Novus partners and implements their knowledge in charting technology.
Free Trial – Available
Cons – Not many charting options
Register here: http://nvd3.org/
Highcharts

Another big name in the charting category, Highcharts also offers a wide range of charts and maps just like the FusionCharts. Bonus – it also offers a separate package featuring stock charts called Highstock. It’s a feature rich collection of charts.
The tool lets you export the completed charts in PDF, JPG, PNG and SVG formats. The demo section of Highcharts shows the different chart types that it offers. For personal and non-commercial use, it’s free of cost, but for commercial use, you would need to purchase a license.
Free Trial – 30 Days
Cons – Offers only 6 graphs currently; not free for commercial use.
Register here: https://www.highcharts.com/
TimelineJS

Needless to mention, that this tool allows you to prepare fascinating timelines without needing any coding skills. TimelineJS is a free and open source software and an easy to use tool that offers four simple steps to make your own timeline. What’s interesting is, it can bring in data from a wide range of sources and also offers support for platforms like YouTube, Twitter, Wikipedia, Google Maps, SoundCloud, Flickr, Vimeo, and more. and, that all comes built-in.
Free Trial – Free and open source
Cons – Doesn’t allow you to upload media from computer.
Register here: http://timeline.knightlab.com/
Data visualisation is the need of the moment. If you want to make a smarter presentation that’s capable of grabbing the much-needed attention, go for these data visualization tools and surprise everyone with your talent.