This looks like your graphics card is too small for the model. But, is not the case here. You load a model that should fit. The replies crawl out a word at a time, the whole PC stutters, and Task Manager shows something odd: dedicated GPU memory nearly full, plus a few gigabytes of “shared” memory in use too.
What’s Actually Going On
Here’s what’s going on. LM Studio’s AutoFit picks your load settings for you, and it aims to use as much of the GPU as it can. But it doesn’t always count everything. A big context window (how much text the model can hold onto at once) eats a lot of video memory. So do extra parallel slots, where the engine sets up two or four copies of that memory so it can answer several requests at once. One user found theirs running four slots at over 170,000 tokens of context. That’s a lot of memory nobody asked for.
When it all doesn’t fit, the NVIDIA driver quietly moves the overflow into shared memory. That’s regular system RAM the graphics card borrows over the PCIe slot (the connector the card plugs into). It works. But it’s many times slower than the card’s own memory.
So the fixes below pull everything back inside your card’s real memory. Start with Fix 1, because most of the others need it.
Fix 1 – Switch to Manual Load Parameters
AutoFit is what overfills the card. So the first job is taking the wheel.
1 – Open LM Studio and go to the model picker at the top.
2 – Turn on Manually choose model load parameters, or click the gear icon next to the model you want.
3 – Pick your model.
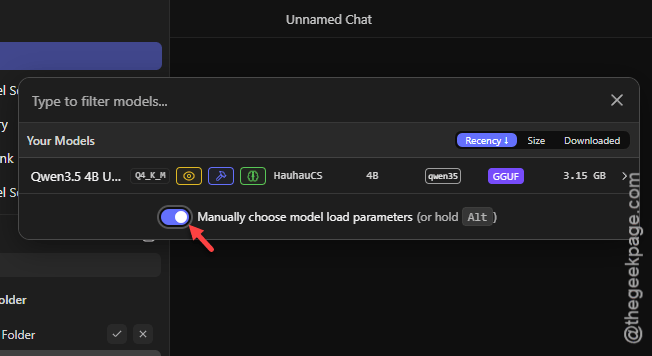
The advanced sliders for GPU Offload and Context Length should now be editable. If they’re still grayed out, unload the model first (the eject button next to its name) and pick it again.
Fix 2 – Lower the Context Length
This is the big one. Context length uses up video memory in a straight line: double the context, roughly double that chunk of memory. A large window can add 4 to 6 GB on its own.
1 – In the load settings from Fix 1, find the Context Length slider.
2 – Drag it down to 8192. On a card with 8 GB or less, try 4096.
3 – Load the model.
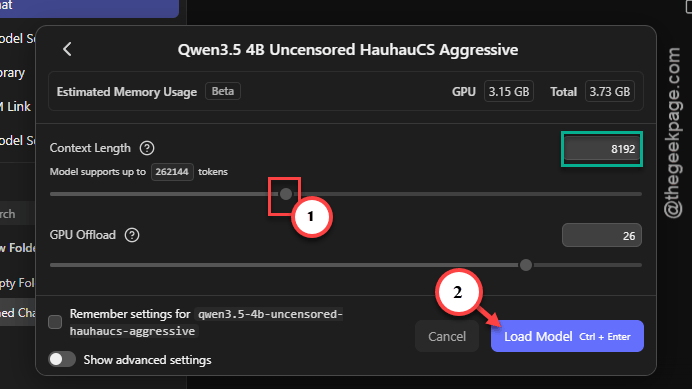
Wondering if 8192 is enough? For normal chats, yes, easily. Long documents or big codebases need more, so raise it a step at a time and watch the memory estimate at the top of the panel.
What about the GPU Offload slider? Leave it at max for now. Moving layers off the card slows down every reply. Lowering the context only limits how long a conversation can get, and that’s the better trade for most people.
Fix 3 – Turn On Flash Attention and an 8-Bit KV Cache
The KV cache is the model’s short-term memory of your conversation. By default it’s stored at full precision. Switching it to 8-bit (Q8_0) cuts its size roughly in half, and you won’t notice a quality difference in normal use. Flash Attention helps the card move that memory around faster.
1 – Open the load settings for your model. Then, enable the Show Advanced settings option.
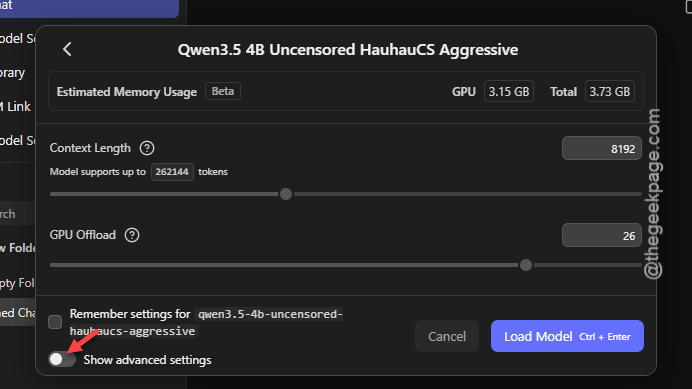
2 – In the panel on the right, tick Flash Attention.
3 – Change KV Cache Quantization to Q8_0.
4 – Load the model.

Look at the estimated memory at the top of the panel before you load. It should drop right away. That’s your confirmation.
Fix 4 – Cut Parallel Slots Down to One
Each parallel slot keeps its own copy of the context memory. Four slots at a big context? That’s four times the memory, and it’s the most common reason people see spillover on cards that should be plenty big. Unless several apps hit LM Studio at the same time, you only need one.
Not sure if anything else uses it? If you only chat inside the LM Studio window itself, nothing does. One slot is fine.
Open the model’s load settings, find the parallel requests (or slots) setting, and set it to 1. Then reload the model.
Fix 5 – Load the Model From the Command Line
Here’s something odd. LM Studio’s engine follows settings you give it on the command line exactly, even when AutoFit would pick something bigger. One user’s replies went from 34 seconds to 3 seconds doing this. Worth the five minutes.
1 – Open PowerShell from the Start menu.
2 – Run npx lmstudio install-cli to install the lms command. You only do this once.
3 – Close PowerShell and open it again so it picks up the new command.
4 – Run lms ps to see what’s loaded right now. If you see PARALLEL 2 or PARALLEL 4 next to a huge context number, that’s your overflow.
5 – Runlms unload --all to clear everything out.
6 – Run lms load --context-length 65536 --gpu max -y, using your model’s name from the lms ps list.
Keep Task Manager open on the Performance tab while you do this. Click your GPU and watch Shared GPU memory. One user on a 32 GB card ended up at about 28 GB dedicated and only half a gigabyte shared, with smooth 3-second replies.
One catch. If another app reloads the model later, it may go back to AutoFit’s choices. So run the same two commands again.
Fix 6 – Stop NVIDIA From Spilling Into System RAM
This tells the NVIDIA driver to refuse the overflow instead of quietly moving it to slow memory. The NVIDIA App moved this setting over from the old NVIDIA Control Panel (version 11.0.6 has it).
1 – Open the NVIDIA App.
2 – Click Graphics in the left sidebar.
3 – Open Global Settings, or Program Settings and pick LM Studio if you only want it there.
4 – Find CUDA – System Fallback Policy.
5 – Set it to Prefer No System Fallback.
Heads up: with fallback off, a model that truly doesn’t fit will fail to load instead of loading slowly. But that’s actually useful. You find out right away and can lower the context, instead of guessing why everything crawls.
Using an AMD or Intel card? This setting won’t exist for you (it’s NVIDIA only). And that’s fine. Fixes 2 to 4 do the heavy lifting on any card.
Fix 7 – Clear LM Studio’s Saved Load Settings
Did LM Studio keep loading with the old bloated settings no matter what you changed? Its saved load state may be stuck. So reset it.
1 – Quit LM Studio completely, including the tray icon near the clock.
2 – Press Windows + R, type %APPDATA%, and press Enter.
3 – Right-click the LM Studio folder and rename it to LM Studio.old.
This keeps a backup of everything in it.
4 – Open LM Studio again. It builds fresh settings.
If your models list comes up empty afterward, quit again and copy the models folder from LM Studio.old back into the new LM Studio folder.
Check if this works.
Keep It From Coming Back
- Leave Manually choose model load parameters on. AutoFit is the reason you’re here.
- Check the memory estimate before every load. If it’s above your card’s dedicated memory, lower the context first. It’s the cheapest fix.
- Keep Task Manager’s Shared GPU memory graph in view the first time you try a new model. A climbing line means spillover. You’ll spot it in seconds.
- Recheck after LM Studio updates. New versions sometimes reset load settings back to the defaults (annoying, but it happens).
People Also Ask
Why is LM Studio so slow?
Most often, the model and its context don’t fit in your graphics card’s own memory, so the overflow spills into much slower shared system memory. AutoFit and extra parallel slots make this worse. Lower the context length, use one slot, and turn on Q8_0 KV cache with Flash Attention.
How do I clear VRAM in LM Studio?
Unload the model with the eject button next to its name, or run lms unload –all in PowerShell. Both free the video memory right away. If memory still looks full afterward, quit LM Studio from the system tray. Closing the window alone sometimes leaves the server running.