Whether you are into some kind of business or into academics, statistics is one crucial aspect that makes data analysis an essential aspect. It’s a new trend that’s keeping every company busy these days as this helps them understand customer expectations while ensuring data driven quality programs at the same time.
There are different software available nowadays that can help companies with organizing, analysing, and interpreting data. Whether it’s a simple tool like a calculator or customized solutions designed to meet individual requirements, statistical software are increasingly getting popular among brands throughout all sectors.
The best part is, statistical software are capable of analysing detailed statistics that’s something that organizes data from samples and likely statistics drawing conclusion from the input data. The biggest advantage of this application is that it offers fact-based data suitable for your business and project.
Let’s look at some of the best statistical software useful for your business or project.
MaxStat

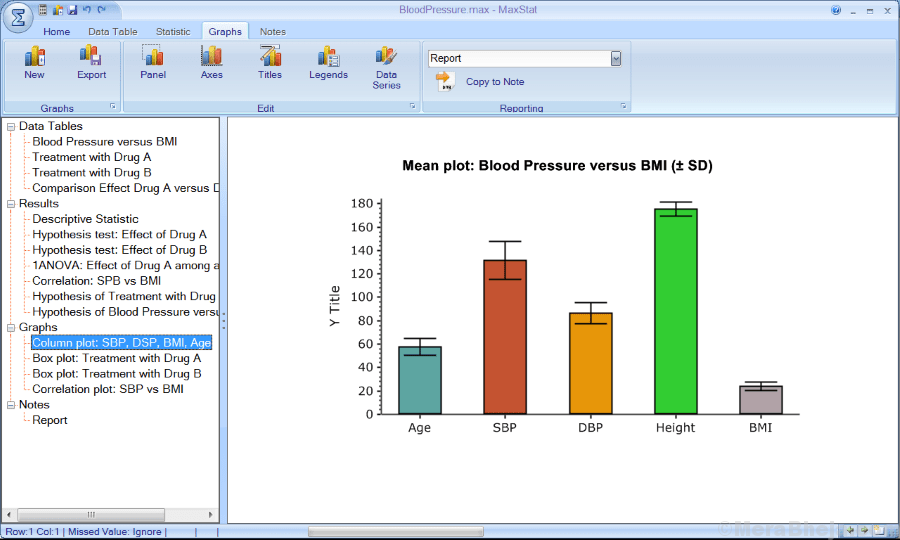
One of the best software in the category for learning statistics, MaxStat comes fully packed with features at an affordable price. With the help of this software, you can create statistical analysis in three simple steps. The best part is, it’s easy to use and is especially useful for students and business editors.
Price: $39 for students; $79 for advanced users
Get it here: https://maxstat.de/en/home-en/
MATLAB

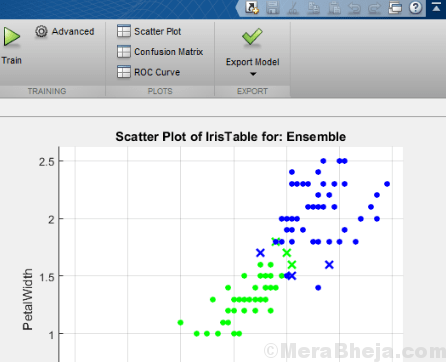
If you are into programming, there could be no alternative to the MATLAB software. It creates a programming environment for algorithm creation, data analysis, numerical calculation, and visualization. Ideal for math lovers, this special app helps you create tables, graphs, equations, and a wide set of other tools to help create and edit technical work easily.
Price: For non-academic users – $2150 (perpetual) or $860 (annual)
Get it here: https://www.mathworks.com/products/matlab.html
AcaStat

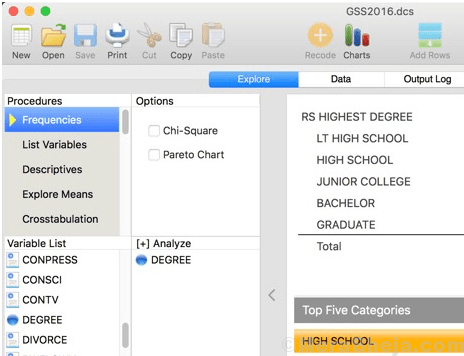
Available on both Windows and other OS platform, AcaStat is one of the statistics software that’s super effective. It allows you to format variables like values, labels, and configure controls easily which is one of its exclusive features. Moreover, it allows you to import data from your spreadsheet files using the copy and paste tool. The best part is, AcaStat analyses data fast that helps you to design logistic details, OLS, and frequency tables.
Price: Starts from $10
Get it here: https://www.acastat.com/
SPSS

SPSS software by IBM help you maximize the benefits of the data in your organization by helping you find new connections in the data and forecast what will possibly happen next. Its predictive analytics can unleash unanticipated patterns and relations and create models to take through front-line interaction.
Price: Starts from $1.00/one-time/user
Get it here: https://www.ibm.com/analytics/spss-statistics-software
jasp stats

jasp stats is based on Bayesian Filtering Library is not just an open source C++ library for recurrent Bayesian estimation, but also is a part of the orocos project. This program was originally written by Klaas Gadeyene and now taken care of by Tinne De Laet. The program runs on all the major platforms like Linux, Mac OS X, Microsoft. Among some its features are kamen filtering, moisture filters, grid based systems, particle filters, and sequential Monte Carlo methods.
Get it here: https://jasp-stats.org/
ADaMSoft

ADamSoft is a free and open source software that’s based on Java and so, can run on any system supporting Java software. It can carry out a large variety of analytical techniques such as data mining, record linkage methods, cluster analysis, graphs, logistic and liner regression, and so on. Bonus – this software can also read and write statistical data values from various different sources like Oracle, ODBC data sources, text files, MySQL, excel spreadsheets, and Postgresql.
Price: Free and open source
Get it here: http://adamsoft.sourceforge.net/
Statwing

Satwing is the perfect tool for those with instant requirement to perform statistical analysis. It comes with a simple interface with e qually simple instructions that makes it a breeze for you to generate data. The software helps the users to conveniently select the framework for analysis that offers a high degree of confidence to the statistical outputs. As a bonus, you also get access to basic charting like bar charts and histogram that can be sent over to spreadsheets.
Price: 14-days free trial available; upgrade starts from $25
Get it here: https://www.statwing.com/
Minitab 18

Thousands of companies and institutions across the world have been using Minitab since it’s launch. It comes with a lot of tools and features that are designed to meet different statistical patterns and analysis. This software helps you with mathematical techniques like confidence intervals to analyse the mean or median off your data.
Moreover, it also comes with unique technique for model reduction that allows the program to find the best regression equation for your sample data. The statistical inferences received from Minitab are precise. It also allows you to bring in Excel files to the software.
Price: Starts from $29 for six months
Get it here: http://www.minitab.com/en-us/
Stata
Stata is a complete statistical software package that offers all that you require to carry out data analysis, graphics, and data management. All you need is a PC with enough memory, and the software can accept huge quantities of data and generate graphs very quick.
What’s more? It can also perform different types of regressions, check data from surveys, and will accept a variance of data inputs to use in the processing. It can assess data sets across time, save whatever you have analysed, clean and arrange the data, create duplicate variable, and export your outputs.
Price: Starts at $45 for students
Get it here: https://www.stata.com
Statistix
Statistix is an intuitive statistical software and easy to use as well. What’s good about it is that it’s comprehensive, yet not too over the top. Moreover, it comes with basic and advanced statistics in one affordable package. The program offers some strong manipulation tools, support for import/export of Excel data and text files, linear models, non-linear regression, and so on.
Price: Free trial available; upgrade starts from $99
Get it here: https://www.statistix.com/
SAS Business Intelligence
SAS Business Intelligence offers the correct insights to those who need it. It helps you integrate and find data on your own, prepare and share interactive reports, raise your eagerness with simple analytics, and track key measures so that when something goes wrong, you would know how to go about it.
Among its advantages are its ability to view the data and accordingly discover patterns quickly. Features like heat maps help you find out where the maximum traffic is driven from. It also allows to integrate with other open source programs like R.
Price: $9,000/year/user
Get it here: https://www.sas.com/en_in/solutions/business-intelligence.html
Intrinsic Noise Analyser
If you are looking for an open source software, Intrinsic Noise Analyser can be your best bet. It’s designed especially for learning reaction kinetics in living cells and using this, it analyses mathematical models of intracellular reaction kinetics for instance, gene expression, regulatory networks, etc. The advantage of this software is that it can offer a better method to achieve the required statistics using system size expansion of the chemical master equation which is a better systematic approach for analytical approximation.
Price: Free and open source
Get it here: https://www.softpedia.com/get/Science-CAD/Intrinsic-Noise-Analyzer.shtml
GraphPad Prism
GraphPad Prism has been the world’s top analysis and graphic solution software built especially for scientific research. It helps simplify statistics, interpret work accurately, and depict a story with the data. Among its advantages are its flexible formatting, several common statistical analyses, and best of all, it’s ease of use and to learn.
Price: $150/year/user
Get it here: https://www.graphpad.com/scientific-software/prism/
Mondrian
Mondrian is a regular use software for statistical data visualization that comes equipped with interactive data visualization instruments. Moreover, the software also offers a variety of interactions and queries as well because the plots in the software are entirely linked.
Barcharts, histograms, Mosaic Plot, Boxplots, SPOM maps, and scatterplots are some of the applied plots in Mondrian that is highlighted. The program also offers basic support for working straight away on data in databases. Bonus – it offers statistical measures like interactive density estimation, multidimensional scaling, and scatterplot smoothers.
Price: Free
Get it here: https://sourceforge.net/projects/mondrian/
Analyse-it
Analyse-it blends into Microsoft Excel to offer the compelling statistical analysis you are looking for from an expensive statistics package minus the cost or complications. From conventional statistical study with hypothetical testing, ANOVA & PCA, or model fitting to statistical process control, the software meets various customer needs through four editions. It’s an easy to use software that automatically starts as the Excel loads up, adding a new menu entry to the ribbon.
Price: Starts at £179.00
Get it here: https://analyse-it.com/
Pandas
Pandasis a software library specially written for the Python priming language. It is used for manipulating and analysing data. It comes with data structures and operations that can be used to manipulate the time series and the numerical tables.
Among its many features are, inclusion of a data frame object that can be used for manipulation of data in association with integrated indexing, different tools for reading and writing data for its memory structures as well as for various file formats, data alignment and integrated management of missing data, option to reshaping and pivoting of data sets, hierarchical axis that can list work from high to low data structure.
Price: Open source
Get it here: https://pandas.pydata.org/
SigmaPlot
Offering over 100 different 2D and 3D graph types, Sigmaplot offers not just helps with simple 2D scatter plots, but also powerful contour plots like the exact technical graph variant you require for your critical research. It features some of the industry -oriented modules that include Curve Analysis Module, Electrophysiology, Ligand Binding Module, and Enzyme Kinetics.
The best part about the software is the quality of the graphs generated which are much superior in comparison to similar other software. Additionally, the loads of basic and advanced data analysis options are a bonus.
Price: Starts from $199/user
Get it here: http://www.sigmaplot.co.uk/products/sigmaplot/sigmaplot-details.php
Shogun
Written in C++ language, Shogun is a free and open source toolbox that provides a number of algorithms and data structure to assist with machine learning problems. The software is licensed under General Public License, GNU and focuses on kernel machines like support vector machines to classify problems and regression. Additionally, the software also provides full application of Hidden Markov models as well.
It also offers interfaces for c#, Octave, Ruby, R, and Java. One of its core features is that it has been designed bioinformatics applications and has the ability to process big datasets that include upto 10 million samples.
Price: Free
Get it here: http://shogun-toolbox.org/
Whatagraph
Whatagraph is a statistical software that generates visual reports to help you understand and monitor the data behind performance of your digital campaigns, your website, and of your ecommerce portal. It allows you to setup automatic report delivery to your chosen email recipients, ensuring that everyone is updated with the latest data.
It allows you to prepare custom reports with chosen metrics, add your own logo, and even change the colour scheme. Whatagraph helps you create reports in a jiffy and that can be downloaded in PDF format directly from your email or your homescreen.
Price: Starts at $59
Get it here: https://whatagraph.com/
DataHero
As a business owner, you can seamlessly connect your cloud services and start bringing the data-based insights to light with immediate effect using DataHero. The program offers data visualization and data dashboarding especially for the business needs. It comes with an intuitive design and compelling features to allow the business stakeholders to divulge insights within their data and convey this to their team.
The software makes it easy to pull out meaning from the data by letting you to visually allocate values to different axes and implement aggregations like averages, totals, summations, and more.
Price: Starts from $59/month
Get it here: https://datahero.com/
So, find the best statistics software from the list, organize your data, analyse and interpret in the best possible way to drive your business to success with high-quality analysis.